

Lab 04 - Processes. Dynamic Analysis
ELF Format Continued
The ELF format allows executable files to be dynamically linked. Instead of linking all the source files that contain subroutines into the final binaries, separate binaries are organized in libraries that can be loaded per use case, on demand. Essentially, the libraries are loaded only once into memory and when a program instance requires a subroutine from a specific library. In this case, it inquires a special OS component about it and new resources are allocated only for the volatile parts of the library image (.bss and .data).
Symbol Table
One of the initial goals of the ELF format was to enable dynamic linking. Given the machine code of a binary, various elements inside it will use absolute addresses that are based on the memory address where the binary expects to be loaded. The entire idea of shared libraries is that these can be loaded and unloaded on demand inside the memory space of whichever process needs them at whichever address is available. As such, a map of how to locate and relocate absolute data points inside the machine code is needed and that's where the symbol table comes in.
readelf -s libtesting.so.1

Symbol table '.dynsym' contains 8 entries:
   Num:    Value  Size Type    Bind   Vis      Ndx Name
     0: 00000000     0 NOTYPE  LOCAL  DEFAULT  UND
     1: 00001339     1 OBJECT  GLOBAL DEFAULT   12 cPub
     2: 000001f8    10 FUNC    GLOBAL DEFAULT    7 fPub
     3: 0000020c   100 FUNC    GLOBAL DEFAULT    7 foo
     4: 00001328    16 OBJECT  GLOBAL DEFAULT   11 a
     5: 00001338     0 NOTYPE  GLOBAL DEFAULT  ABS __bss_start
     6: 0000133c     0 NOTYPE  GLOBAL DEFAULT  ABS _end
     7: 00001338     0 NOTYPE  GLOBAL DEFAULT  ABS _edata

Symbol table '.symtab' contains 27 entries:
   Num:    Value  Size Type    Bind   Vis      Ndx Name
     0: 00000000     0 NOTYPE  LOCAL  DEFAULT  UND
     1: 000000b4     0 SECTION LOCAL  DEFAULT    1
     2: 000000e8     0 SECTION LOCAL  DEFAULT    2
     3: 00000168     0 SECTION LOCAL  DEFAULT    3
     4: 000001a8     0 SECTION LOCAL  DEFAULT    4
     5: 000001d0     0 SECTION LOCAL  DEFAULT    5
     6: 000001d8     0 SECTION LOCAL  DEFAULT    6
     7: 000001f8     0 SECTION LOCAL  DEFAULT    7
     8: 00001274     0 SECTION LOCAL  DEFAULT    8
     9: 00001314     0 SECTION LOCAL  DEFAULT    9
    10: 00001318     0 SECTION LOCAL  DEFAULT   10
    11: 00001328     0 SECTION LOCAL  DEFAULT   11
    12: 00001338     0 SECTION LOCAL  DEFAULT   12
    13: 00000000     0 SECTION LOCAL  DEFAULT   13
    14: 00000000     0 FILE    LOCAL  DEFAULT  ABS libtesting.c
    15: 00000202    10 FUNC    LOCAL  DEFAULT    7 fLocal
    16: 00001338     1 OBJECT  LOCAL  DEFAULT   12 cLocal
    17: 00001318     0 OBJECT  LOCAL  HIDDEN  ABS _GLOBAL_OFFSET_TABLE_
    18: 00000270     0 FUNC    LOCAL  HIDDEN    7 __i686.get_pc_thunk.bx
    19: 00001274     0 OBJECT  LOCAL  HIDDEN  ABS _DYNAMIC
    20: 00001339     1 OBJECT  GLOBAL DEFAULT   12 cPub
    21: 000001f8    10 FUNC    GLOBAL DEFAULT    7 fPub
    22: 0000020c   100 FUNC    GLOBAL DEFAULT    7 foo
    23: 00001328    16 OBJECT  GLOBAL DEFAULT   11 a
    24: 00001338     0 NOTYPE  GLOBAL DEFAULT  ABS __bss_start
    25: 0000133c     0 NOTYPE  GLOBAL DEFAULT  ABS _end
    26: 00001338     0 NOTYPE  GLOBAL DEFAULT  ABS _edata
Some information on the symbols that may belong to external files or may be referenced by external files during dynamic linking are copied in the .dynsym section
- Name - symbol name
- Type
- NoType - not specified
- FUNC - the symbol influences a function
- SECTION - associated with a section
- FILE - a symbol that references a files
- Bind
- LOCAL - the symbol information is not visible outside the object file
- GLOBAL - the symbol is visible to all the files being combined to form the executable
- Size - the size of the symbol in bytes or 0 if it is unknown
- Ndx
- UND - unspecified section reference
- COM - unallocated C external variable
- ABS - an absolute value for the reference
- value - an index into the section table
- Value - if the symbol table is part of an executable, the value will contain a memory address where the symbol resides. Otherwise it will contain an offset from the beginning of the section referenced by Ndx or O.
As you can see, the symbol table as it appears in object files compiled with gcc is quite verbose, revealing function names and visibility as well as variable scopes, names and even sizes. In its default form it even shows the name of the sourcefile.
- strip is your friend
Relocations
Relocations were a concept that was present ever since the invention of static linking. The initial purpose of relocations was to give the static linker a roadmap when combining multiple object files into a binary by stating:
- the symbol that needs to be fixed
- where you can find the symbol (file/section offset)
- an algorithm for making the fixes
The fixes would usually be made in the .data and .text sections and everything was well. Dynamic runtime brought a bit of a complication to modifications that needed to be made in the code segments. The whole idea of shared libraries is that the code can be loaded once into memory from an ELF file then shared among all the processes that use the library. The only way to reliably do this is to make the code section read-only.
In order to compensate for this constraint a special data section called the GOT (global offset table) was created. When the code needs to work with a symbol that belongs to shared object, in the code entry for that symbol uses addresses from the GOT table. First time the symbol is referenced the dynamic linker corrects the entry in GOT and on subsequent calls the correct address will be used.
When implementing calls to subroutines in shared objects, a different table is used called the PLT (procedure linkage table). The initial call is made to a stub sequence in the PLT which bounces off a GOT entry in order to push the subroutine name on the stack and then calls the resolver (mentioned in the INTERP program header).
readelf -r libdynamic.o

Relocation section '.rel.text' at offset 0x5f8 contains 8 entries:
 Offset     Info    Type            Sym.Value  Sym. Name
0000001d  00001402 R_386_PC32        00000000   __i686.get_pc_thunk.bx
00000023  0000150a R_386_GOTPC       00000000   _GLOBAL_OFFSET_TABLE_
00000029  00000409 R_386_GOTOFF      00000000   .bss
0000002f  00000409 R_386_GOTOFF      00000000   .bss
00000035  00000d03 R_386_GOT32       00000004   so_int_global
00000041  00000d03 R_386_GOT32       00000004   so_int_global
00000052  00000e04 R_386_PLT32       00000000   so_fpublic_global
0000005b  00000209 R_386_GOTOFF      00000000   .text

Relocation section '.rel.data.rel.local' at offset 0x638 contains 2 entries:
 Offset     Info    Type            Sym.Value  Sym. Name
00000000  00000401 R_386_32          00000000   .bss
00000004  00000201 R_386_32          00000000   .text

Relocation section '.rel.data.rel' at offset 0x648 contains 2 entries:
 Offset     Info    Type            Sym.Value  Sym. Name
00000000  00000d01 R_386_32          00000004   so_int_global
00000004  00000e01 R_386_32          00000000   so_fpublic_global
- Offset - In relocatable files and linked shared objects it contains the offset from the beginning of the section , where the relocation needs to be applied
- Info - This field is used to derive the index in the symbol table to the affected symbol as well as the algorithm needed for fixing.
- info>>8 - symbol table index
- info&0xff - algorithm type as defined in the documentation
readelf is nice enough to interpret the symbol table for us and gives us the relocation algorithm in the Type field and also the symbol name and value as defined in the symbol table
By looking at the types of relocations we can draw some basic conclusions about the symbol types and also about the files.
- Reloctable Files
- R_386_32 - usually used to reference changes to a local symbol
- R_386_PC32 - reference a relative distance from here to the symbol
- Relocatable Files for Shared object
- R_386_GOTOFF - usually found in the code area, describes the offset from the beginning of GOT to a local symbol
- R_386_GOT32 - also speicific to the code area. These entries persist in the linkage phase
- R_386_PLT32 - used when describing calls to global subroutines. when the linker will read this information it will generate an entry in the GOT and PLT tables
- R_386_GOTPC - used in function to calculate the start address of the GOT
- Executables that use dynamic linking
- R_386_JMP - the dynamic linker will deposit the address of the external subroutine during execution
- R_386_COPY - the address of global variable from shared object will be deposited here
- Shared object files
- R_386_JMP - the dynamic linker will deposit the address of the external subroutine from one of the shared object dependencies during execution
- R_386_GLOB_DATA - used to deposit the address of a global symbol defined in one of the shared object dependencies
- R_386_RELATIVE - at link time all the R_386_GOTOFF entries are fixed and these relocation will contain absolute addresses
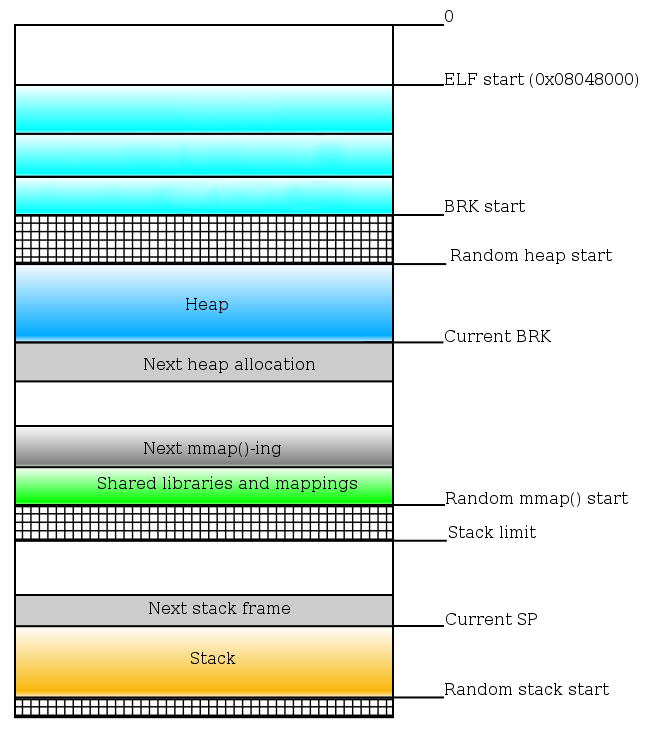
Memory layout of a process
To understand the full picture of program execution it is vital to understand the memory layout of processes from ELF executables.
The kernel provides an interface in /proc/<PID>/maps for each process to see how the memory layout looks like.
Let's write a simple Hello World application and investigate.
#include <stdio.h>
int main()
{
	printf("Hello world\n");
	malloc(10000);
	while(1){
		;
	}
	return 0;
}
$ gcc -Wall hw.c -o hw -m32
$ ./hw  &
[1] 4771
Hello world
$ cat /proc/4771/maps
08048000-08049000 r-xp 00000000 08:06 1843771                            /tmp/hw
08049000-0804a000 r--p 00000000 08:06 1843771                            /tmp/hw
0804a000-0804b000 rw-p 00001000 08:06 1843771                            /tmp/hw
0804b000-0806e000 rw-p 00000000 00:00 0                                  [heap]
f7ded000-f7dee000 rw-p 00000000 00:00 0
f7dee000-f7f93000 r-xp 00000000 08:06 917808                             /lib32/libc-2.17.so
f7f93000-f7f95000 r--p 001a5000 08:06 917808                             /lib32/libc-2.17.so
f7f95000-f7f96000 rw-p 001a7000 08:06 917808                             /lib32/libc-2.17.so
f7f96000-f7f99000 rw-p 00000000 00:00 0
f7fd9000-f7fdb000 rw-p 00000000 00:00 0
f7fdb000-f7fdc000 r-xp 00000000 00:00 0                                  [vdso]
f7fdc000-f7ffc000 r-xp 00000000 08:06 917869                             /lib32/ld-2.17.so
f7ffc000-f7ffd000 r--p 0001f000 08:06 917869                             /lib32/ld-2.17.so
f7ffd000-f7ffe000 rw-p 00020000 08:06 917869                             /lib32/ld-2.17.so
fffdd000-ffffe000 rw-p 00000000 00:00 0                                  [stack]
If we start another process in the background the output for it will be exactly the same as this one. Why is that? The answer, of course, is virtual memory. The kernel provides this mechanism through which each process has an address space completely isolated from that of other running processes. They can still communicate using inter-process communication mechanisms provided by the kernel but we won't get into that here.
Executable
Heap
Memory mappings and libraries
Stack
Segmentation Fault
Summary of memory layout without ASLR

Address Space Layout Randomization
GDB Basic Commands
Getting help with GDB
Whenever you want to find out more information about GDB commands feel free to search for it inside the documentation or by using the help command followed by your area of interest. For example searching for help for the disassemble command can be obtained by running the following command in GDB:
#print info about all help areas available
#identify the area of your question
(gdb) help
#print info about available data commands
#identify the command you want to learn more about
(gdb) help data
#print info about a specific command
#find out more about the command you are searching for
(gdb) help disassemble
Opening a program with GDB
A program can be opened for debugging in a number of ways. We can run GDB directly attaching it to a program:
$ gdb [executable-file]
Or we can open up GDB and then specify the program we are trying to attach to using the file or file-exec command:
$ gdb
(gdb) file [executable-file]
Furthermore we can attach GDB to a running service if we know it's process id:
$ gdb --pid [pid_number]
Disassembling
GDB allows disassembling of binary code using the disassemble command (it may be shortened to diasas). The command can be issued either on a memory address or using labels.
(gdb) disas *main
Dump of assembler code for function main:
=> 0x080484c4 <+0>:,  push   ebp
   0x080484c5 <+1>:,  mov    ebp,esp
   0x080484c7 <+3>:,  and    esp,0xfffffff0
   0x080484ca <+6>:,  sub    esp,0x30
   0x080484cd <+9>:,  mov    DWORD PTR [esp+0x12],0x24243470
   0x080484d5 <+17>:,mov    DWORD PTR [esp+0x16],0x64723077
   0x080484dd <+25>:,mov    WORD PTR [esp+0x1a],0x21
....Output ommited.....
(gdb) disas 0x080484c4
Dump of assembler code for function main:
=> 0x080484c4 <+0>:,  push   ebp
   0x080484c5 <+1>:,  mov    ebp,esp
   0x080484c7 <+3>:,  and    esp,0xfffffff0
   0x080484ca <+6>:,  sub    esp,0x30
   0x080484cd <+9>:,  mov    DWORD PTR [esp+0x12],0x24243470
   0x080484d5 <+17>:,mov    DWORD PTR [esp+0x16],0x64723077
   0x080484dd <+25>:,mov    WORD PTR [esp+0x1a],0x21
Adding Breakpoints
Breakpoints are important to suspend the execution of the program being debugged in a certain place. Adding breakpoints is done with the break command. A good idea is to place a breakpoint at the main function of the program you are trying to exploit. Given the fact that you have already run objdump and disassembled the program you know the address for the start of the main function. This means that we can set a breakpoint for the start of our program in two ways:
(gdb) break *main
(gdb) break *0x[main_address_obtained_with_objdump]
The general format for setting breakpoints in GDB is as follows:
(gdb) break [LOCATION] [thread THREADNUM] [if CONDITION]
break command with no parameters will place a breakpoint at the current address.
The abbreviated command for setting breakpoints is simply b.
Listing Breakpoints
At any given time all the breakpoints in the program can be displayed using the info breakpoints command:
(gdb) info breakpoints
(gdb) i b
Deleting Breakpoints
Breakpoints can be removed by issuing the delete breakpoints command followed by the breakpoints number, as it is listed in the output of the info breakpoints command.
(gdb) delete breakpoints [breakpoint_number]
delete breakpoints command with no parameters:
(gdb) delete breakpoints
Once a breakpoint is set you would normally want to launch the program into execution. You can do this by issuing the run command. The program will start executing and stop at the first breakpoint you have set.
(gdb) run
Execution flow
Execution flow can be controlled in GDB using the continue, stepi, nexti as follows:
(gdb) help continue
#Continue program being debugged, after signal or breakpoint.
#If proceeding from breakpoint, a number N may be used as an argument,
#which means to set the ignore count of that breakpoint to N - 1 (so that
#the breakpoint won't break until the Nth time it is reached).
(gdb) help stepi
#Step one instruction exactly.
#Argument N means do this N times (or till program stops for another reason).
(gdb) help nexti
#Step one instruction, but proceed through subroutine calls.
#Argument N means do this N times (or till program stops for another reason).
c (continue), si (stepi), ni (nexti).
run command.
Another technique that can be used for setting breakpoints is using offsets.
(gdb) break *main
Breakpoint 1 at 0x80484c4
(gdb) run
Starting program: bash_login

Breakpoint 1, 0x080484c4 in main ()
(gdb) disas main
Dump of assembler code for function main:
=> 0x080484c4 <+0>:,  push   ebp
   0x080484c5 <+1>: ,mov    ebp,esp
   0x080484c7 <+3>: ,and    esp,0xfffffff0
   0x080484ca <+6>: ,sub    esp,0x30
   0x080484cd <+9>: ,mov    DWORD PTR [esp+0x12],0x24243470
   0x080484d5 <+17>:,mov    DWORD PTR [esp+0x16],0x64723077
   0x080484dd <+25>:,mov    WORD PTR [esp+0x1a],0x21

.....Output ommited.....
(gdb) break *main+6
Breakpoint 2 at 0x80484ca
Examine and Print, your most powerful tools
GDB allows examining of memory locations be them specified as addresses or stored in registers. The x command (for examine) is arguably one of the most powerful tool in your arsenal and the most common command you are going to run when exploiting.
The format for the examine command is as follows:
(gdb) x/nfu [address]
        n:  How many units to print
        f:  Format character
              a Pointer
              c Read as integer, print as character
              d Integer, signed decimal
              f Floating point number
              o Integer, print as octal
              s Treat as C string (read all successive memory addresses until null character and print as characters)
              t Integer, print as binary (t="two")
              u Integer, unsigned decimal
              x Integer, print as hexadecimal
        u:  Unit
              b: Byte
              h: Half-word (2 bytes)
              w: Word (4 bytes)
              g: Giant word (8 bytes)
              i: Instruction (read n assembly instructions from the specified memory address)
In contrast with the examine command, which reads data at a memory location the print command (shorthand p) prints out values stored in registers and variables.
The format for the print command is as follows:
(gdb) p/f [what]
        f:  Format character
              a Pointer
              c Read as integer, print as character
              d Integer, signed decimal
              f Floating point number
              o Integer, print as octal
              s Treat as C string (read all successive memory addresses until null character and print as characters)
              t Integer, print as binary (t="two")
              u Integer, unsigned decimal
              x Integer, print as hexadecimal
              i Instruction (read n assembly instructions from the specified memory address)
For a better explanation please follow through with the following example:
#a breakpoint has been set inside the program and the program has been run with the appropriate commands to reach the breakpoint
#at this point we want to see which are the following 10 instructions
(gdb) x/10i 0x080484c7
   0x80484c7 <main+3>:,and    esp,0xfffffff0
   0x80484ca <main+6>:,sub    esp,0x30
   0x80484cd <main+9>:,mov    DWORD PTR [esp+0x12],0x24243470
   0x80484d5 <main+17>:,mov    DWORD PTR [esp+0x16],0x64723077
   0x80484dd <main+25>:,mov    WORD PTR [esp+0x1a],0x21
   0x80484e4 <main+32>:,mov    eax,0x8048630
   0x80484e9 <main+37>:,mov    DWORD PTR [esp],eax
   0x80484ec <main+40>:,call   0x80483b0 <printf@plt>
   0x80484f1 <main+45>:,mov    eax,0x804864a
   0x80484f6 <main+50>:,lea    edx,[esp+0x1c]
#let's examine the memory at 0x80486a0 because we have a hint that the eax register holds a parameter
#as it is then placed on the stack (we'll explain later how we have reached this conclusion)
(gdb) x/s 0x80486a0
0x80486a0:, "\nPlease provide password:"
# we now set a breakpoint for main+49
(gdb) break *0x80484e9
Breakpoint 3 at 0x80484e9
(gdb) continue
Continuing.

Breakpoint 3, 0x080484e9 in main ()

#let's examine the eax register (it should hold the address for the beginning of the string so let's interpret it as appropriately)
#take note that in GDB registers are preceded by the "$" character very much like variables
(gdb) x/s $eax
0x8048630:, "\nPlease provide password:"
#now let's print the contents of the eax register as hexadecimal
(gdb) p/x $eax
$1 = 0x8048630
# as you can see the eax register hold the memory for the beginning of the string
# this shows you how "x" interprets data from memory while "p" merely prints out the contents in the required format
# you can think of it as "x" dereferencing while "p" not dereferencing
GDB command file
When exploiting, there are a couple of commands that you will issue periodically and doing that by hand will get cumbersome. GDB commands files will allow you to run a specific set of commands automatically after each command you issue manually. This comes in especially handy when you're stepping through a program and want to see what happens with the registers and stack after each instruction is ran, which is the main target when exploiting.
The examine command online has sense when code is already running on the machine so inside the file we are going to use the display command which translates to the same output.
In order to use this option you must first create your commands file. This file can include any GDB commands you like but a good start would be printing out the content of all the register values, the next ten instructions that are going to be executed, and some portion from the top of the stack.
The reason for examining all of the above after each instruction is ran will become more clear once the we go through the second section of the session.
Command file template:
display/10i $eip
display/x $eax
display/x $ebx
display/x $ecx
display/x $edx
display/x $edi
display/x $esi
display/x $ebp
display/32xw $esp
x command. However the values of all registers can be obtained by running the info all-registers command:
(gdb) info all-registers
eax            0x8048630,134514224
ecx            0xbffff404,-1073744892
edx            0xbffff394,-1073745004
ebx            0xb7fc6ff4,-1208193036
esp            0xbffff330,0xbffff330
ebp            0xbffff368,0xbffff368
esi            0x0,0
edi            0x0,0
eip            0x80484e9,0x80484e9 <main+37>
eflags         0x286,[ PF SF IF ]
cs             0x73,115
ss             0x7b,123
ds             0x7b,123
es             0x7b,123
fs             0x0,0
gs             0x33,51
st0            *value not available*
st1            *value not available*
st2            *value not available*
st3            *value not available*
st4            *value not available*
st5            *value not available*
st6            *value not available*
st7            *value not available*
fctrl          0x37f,895
fstat          0x0,0
ftag           0xffff,65535
fiseg          0x0,0
fioff          0x0,0
foseg          0x0,0
---Type <return> to continue, or q <return> to quit---
fooff          0x0,0
fop            0x0,0
mxcsr          0x1f80,[ IM DM ZM OM UM PM ]
ymm0           *value not available*
ymm1           *value not available*
ymm2           *value not available*
ymm3           *value not available*
ymm4           *value not available*
ymm5           *value not available*
ymm6           *value not available*
ymm7           *value not available*
mm0            *value not available*
mm1            *value not available*
mm2            *value not available*
mm3            *value not available*
mm4            *value not available*
mm5            *value not available*
mm6            *value not available*
mm7            *value not available*
0xbffff…. format.
-x [command_file] parameter.
GDB PEDA
As you can see using GDB can be cumbersome, this is why we recommend using the PEDA (Python Exploit Development Assistance for GDB) plugin presented in the previous session.
Give the fact that PEDA is just a wrapper, all the functionality of GDB will be available when running gdb-peda.
- Automatic preview of registers, code and stack after each instruction (you no longer need to create your own commands file)
- Automatic dereferencing and following through of memory locations
- Color coding
Installation
You can download peda using:
git clone https://github.com/longld/peda.git ~/peda
To set it up add the following to your ~/.gdbinit file and then run gdb as usual:
- .gdbinit
# Source all settings from the peda dir
source ~/peda/peda.py

# These are other settings I have found useful

# When inspecting large portions of code the scrollbar works better than 'less'
set pagination off


# Keep a history of all the commands typed. Search is possible using ctrl-r
set history save on
set history filename ~/.gdb_history
set history size 32768
set history expansion on
PEDA Commands
pdis command gives a pretty output that is similar to what the disas command in GDB prints:
Usage: pdis main
If pdis is used with an address as a parameter, the output will be similar to what x/Ni prints out (where N is the number of instructions you want to disassemble)
Usage: -pdis [address]/N - where N is the number of instructions you want to be printed
The stepi command has the same effect as in GDB however, if you are running PEDA you will notice that after each step PEDA will automatically print register values, several lines of code from eip register and a portion of the stack:
gdb-peda$ stepi
[----------------------------------registers-----------------------------------]
EAX: 0x1
EBX: 0xb7fc6ff4 --> 0x1a0d7c
ECX: 0xbffff404 --> 0xbffff569 ("/home/dgioga/sss/bash_login")
EDX: 0xbffff394 --> 0xb7fc6ff4 --> 0x1a0d7c
ESI: 0x0
EDI: 0x0
EBP: 0xbffff368 --> 0x0
ESP: 0xbffff360 --> 0x8048560 (<__libc_csu_init>:,push   ebp)
EIP: 0x80484ca (<main+6>:,sub    esp,0x30)
EFLAGS: 0x286 (carry PARITY adjust zero SIGN trap INTERRUPT direction overflow)
[-------------------------------------code-------------------------------------]
   0x80484c4 <main>:,push   ebp
   0x80484c5 <main+1>:,mov    ebp,esp
   0x80484c7 <main+3>:,and    esp,0xfffffff0
=> 0x80484ca <main+6>:,sub    esp,0x30
   0x80484cd <main+9>:,mov    DWORD PTR [esp+0x12],0x24243470
   0x80484d5 <main+17>:,mov    DWORD PTR [esp+0x16],0x64723077
   0x80484dd <main+25>:,mov    WORD PTR [esp+0x1a],0x21
   0x80484e4 <main+32>:,mov    eax,0x8048630
[------------------------------------stack-------------------------------------]
0000| 0xbffff360 --> 0x8048560 (<__libc_csu_init>:,push   ebp)
0004| 0xbffff364 --> 0x0
0008| 0xbffff368 --> 0x0
0012| 0xbffff36c --> 0xb7e3f4d3 (<__libc_start_main+243>:,mov    DWORD PTR [esp],eax)
0016| 0xbffff370 --> 0x1
0020| 0xbffff374 --> 0xbffff404 --> 0xbffff569 ("/home/dgioga/sss/bash_login")
0024| 0xbffff378 --> 0xbffff40c --> 0xbffff585 ("SSH_AGENT_PID=1948")
0028| 0xbffff37c --> 0xb7fdc858 --> 0xb7e26000 --> 0x464c457f
[------------------------------------------------------------------------------]
Legend: code, data, rodata, value
0x080484ca in main ()
context regcontext codecontext stackcontext all
One additional PEDA command which can be used to show values in registers is the telescope command. The command dereferentiates pointer values until it gets to a value and prints out the entire trace.
The command can be used with both registers and memory addresses:
gdb-peda$ telescope $eax
0000| 0x8048630 ("\nPlease provide password:")
0004| 0x8048634 ("ase provide password:")
0008| 0x8048638 ("provide password:")
0012| 0x804863c ("ide password:")
0016| 0x8048640 ("password:")
0020| 0x8048644 ("word:")
0024| 0x8048648 --> 0x7325003a (':')
0028| 0x804864c --> 0x0
gdb-peda$ telescope 0x8048630
0000| 0x8048630 ("\nPlease provide password:")
0004| 0x8048634 ("ase provide password:")
0008| 0x8048638 ("provide password:")
0012| 0x804863c ("ide password:")
0016| 0x8048640 ("password:")
0020| 0x8048644 ("word:")
0024| 0x8048648 --> 0x7325003a (':')
0028| 0x804864c --> 0x0
In the example above, the memory address 0x8048630 was loaded into EAX. That is why examining the register or the memory location gives the same output.
help peda command
It is always a better idea to use PEDA commands when available. However you should also know the basics of using GDB as well.
Altering variables and memory with PEDA and GDB
In addition to basic registers, GDB has a two extra variables which map onto some of the existing registers, as follows:
* $pc – $eip
* $sp – $esp
* $fp – $ebp
In addition to these there are also two registers which can be used to view the processor state
$ps – processor status
Values of memory addresses and registers can be altered at execution time. Because altering memory is a lot easier using PEDA we are going to use it throughout today's session.
set GDB command.
The easiest way of altering the execution flow of a program is editing the $eflags register just before jump instructions.
Using PEDA the $eflags register can be easily modified:
gdb-peda$ eflags
EFLAGS: 0x286 (carry PARITY adjust zero SIGN trap INTERRUPT direction overflow)
gdb-peda$ help eflags
Display/set/clear value of eflags register
Usage:
    eflags
    eflags [set|clear] flagname
eflags command is issued.
The patch command can be used to modify values that reside inside memory.
gdb-peda$ telescope 0x8048630
0000| 0x8048630 ("\nPlease provide password:")
0004| 0x8048634 ("ase provide password:")
0008| 0x8048638 ("provide password:")
0012| 0x804863c ("ide password:")
0016| 0x8048640 ("password:")
0020| 0x8048644 ("word:")
0024| 0x8048648 --> 0x7325003a (':')
0028| 0x804864c --> 0x0
gdb-peda$ help patch
Patch memory start at an address with string/hexstring/int
Usage:
    patch address (multiple lines input)
    patch address "string"
    patch from_address to_address "string"
    patch (will patch at current $pc)

gdb-peda$ patch 0x8048630 "Modified valu of the string\x00"
Written 28 bytes to 0x8048630
gdb-peda$ telescope 0x8048630
0000| 0x8048630 ("Modified valu of the string")
0004| 0x8048634 ("fied valu of the string")
0008| 0x8048638 (" valu of the string")
0012| 0x804863c ("u of the string")
0016| 0x8048640 (" the string")
0020| 0x8048644 (" string")
0024| 0x8048648 --> 0x676e69 ('ing')
0028| 0x804864c --> 0x0
As you can see the string residing in memory at address 0x8048630 has been modified using the patch command.
PEDA does not offer enhancements in modifying registry values. For modifying registry values you can use the GDB set command.
gdb-peda$ p/x $eax
$10 = 0x1
gdb-peda$ set $eax=0x80
gdb-peda$ p/x $eax
$11 = 0x80
Basic stuff
The most common actions done in gdb are: setting breakpoints, stepping through program execution and examining memory. The following are commands you need to know:
run [args]⇒ restart the program with [args] as argsstepi⇒ execute the current instruction and go to the next one - if it's a call instruction go to that subroutine (step into)nexti⇒ execute the current instruction and go to the next one - if it's a call instruction execute the whole subroutine in the background (step over)break⇒ set a permanent breakpoint on an address or functioninfo break⇒ display all current breakpoints setdelete 2⇒ delete the breakpoint with index 2 (from the list of current breakpoints)continue⇒ continue execution after hitting a breakpoint (or receiving a signal)hexdump <addr> [/NR]⇒ dump NR lines of memory starting from <addr>. (by default NR is 1)x /s <addr>⇒ dump a string starting from <addr> (/100swould dump 100 strings)x /wx <addr>⇒ dump a dword starting from <addr> (/100wxwould dump 100 dwords)
Dynamic analysis shortcuts
In peda you have quick access to information that you would otherwise have to obtain using other tools as presented before:
gdb-peda$ vmmap
Start      End        Perm	Name
0x08048000 0x08049000 r-xp	/tmp/black/crackmes/crackme3
0x08049000 0x0804a000 r--p	/tmp/black/crackmes/crackme3
0x0804a000 0x0804b000 rw-p	/tmp/black/crackmes/crackme3
0xf7ded000 0xf7dee000 rw-p	mapped
0xf7dee000 0xf7f93000 r-xp	/lib32/libc-2.17.so
0xf7f93000 0xf7f95000 r--p	/lib32/libc-2.17.so
0xf7f95000 0xf7f96000 rw-p	/lib32/libc-2.17.so
0xf7f96000 0xf7f99000 rw-p	mapped
0xf7fda000 0xf7fdb000 rw-p	mapped
0xf7fdb000 0xf7fdc000 r-xp	[vdso]
0xf7fdc000 0xf7ffc000 r-xp	/lib32/ld-2.17.so
0xf7ffc000 0xf7ffd000 r--p	/lib32/ld-2.17.so
0xf7ffd000 0xf7ffe000 rw-p	/lib32/ld-2.17.so
0xfffdd000 0xffffe000 rw-p	[stack]
gdb-peda$ elfheader
.interp = 0x8048174
.note.ABI-tag = 0x8048188
.hash = 0x80481a8
.gnu.hash = 0x80481e0
.dynsym = 0x8048204
.dynstr = 0x8048294
.gnu.version = 0x80482f6
.gnu.version_r = 0x8048308
.rel.dyn = 0x8048328
.rel.plt = 0x8048338
.init = 0x8048368
.plt = 0x8048390
.text = 0x8048400
.fini = 0x80486c4
.rodata = 0x80486d8
.eh_frame_hdr = 0x80486fc
.eh_frame = 0x8048738
.init_array = 0x8049f00
.fini_array = 0x8049f04
.jcr = 0x8049f08
.dynamic = 0x8049f0c
.got = 0x8049ffc
.got.plt = 0x804a000
.data = 0x804a024
.bss = 0x804a044
gdb-peda$ elfsymbol
Found 6 symbols
fgets@plt = 0x80483a0
puts@plt = 0x80483b0
__gmon_start__@plt = 0x80483c0
exit@plt = 0x80483d0
strlen@plt = 0x80483e0
__libc_start_main@plt = 0x80483f0
You can also search for strings in the mapped regions:
gdb-peda$ find "Correct"
Searching for 'Correct' in: None ranges
Found 2 results, display max 2 items:
crackme3 : 0x80486ea ("Correct!")
crackme3 : 0x80496ea ("Correct!")

gdb-peda$ find "/bin/sh"
Searching for '/bin/sh' in: None ranges
Found 1 results, display max 1 items:
libc : 0xf7f53be6 ("/bin/sh")
Tasks
Task 1
- Download level01 from Smash the stack and solve it using peda. Break on
*main, step through the execution and figure out what it does and how to crack it.
$ scp level1@io.netgarage.org:/levels/level01 . # Password is level1
Task 2
- Use GDB and PEDA to run the code provided at s5_pp_bash.tar.gz. The executable gets input from the user and evaluates it against a static condition. If it succeeds it then calls a
password_acceptedfunction that prints out a success message and spawns a shell.
Your task is to use GDB and PEDA to force the executable to call the password_accepted function.
Think of modifying registers for forcing the executable to call the function (there is more than one way of doing this).
Extra: GOT/PLT
